Hours by week, month and year: the dashboards
The dashboards add up the hours in your events and the reminders you completed, and break them down by calendar. You can see how many hours went to meetings, to each project or to a habit. Events from iCloud, Google and Exchange calendars are added up the same way. Click the view name in the bar, swipe left with two fingers over the lower half, or press ⌘2 / ⌘3.
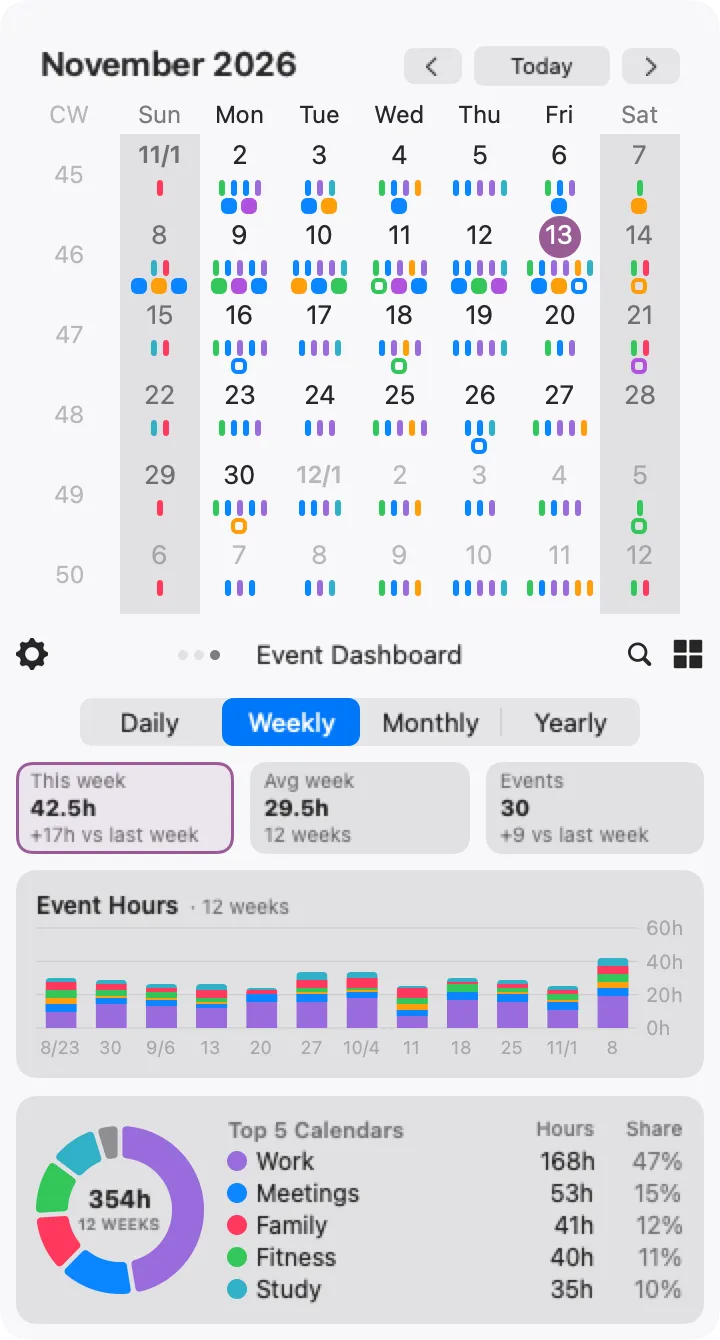
The numbers first
Section titled “The numbers first”The three tiles at the top answer the question before you read the charts:
- This week (or Today / This month / This year) — the hours in the current period, and the difference from the previous one: last week, last month, last year, or for Daily the same weekday last week
- Avg week (or Avg day / Avg month / Avg year) — the average over the periods shown in the bar chart
- Events — the number of events in the current period, with the same comparison
The hours are the hours in your events, so a day that has not ended yet already counts everything scheduled for it. All-day events are not counted as hours; they are counted as events. An event that crosses the edge of a period counts only the part that falls inside it.
Hours or count
Section titled “Hours or count”Click This week to see the charts in hours, or Events to see them as a count. The selected tile has a thin frame, and Calinsight remembers the choice. In count mode, the striped part of a bar is the all-day events — the ones that do not add to the hours.
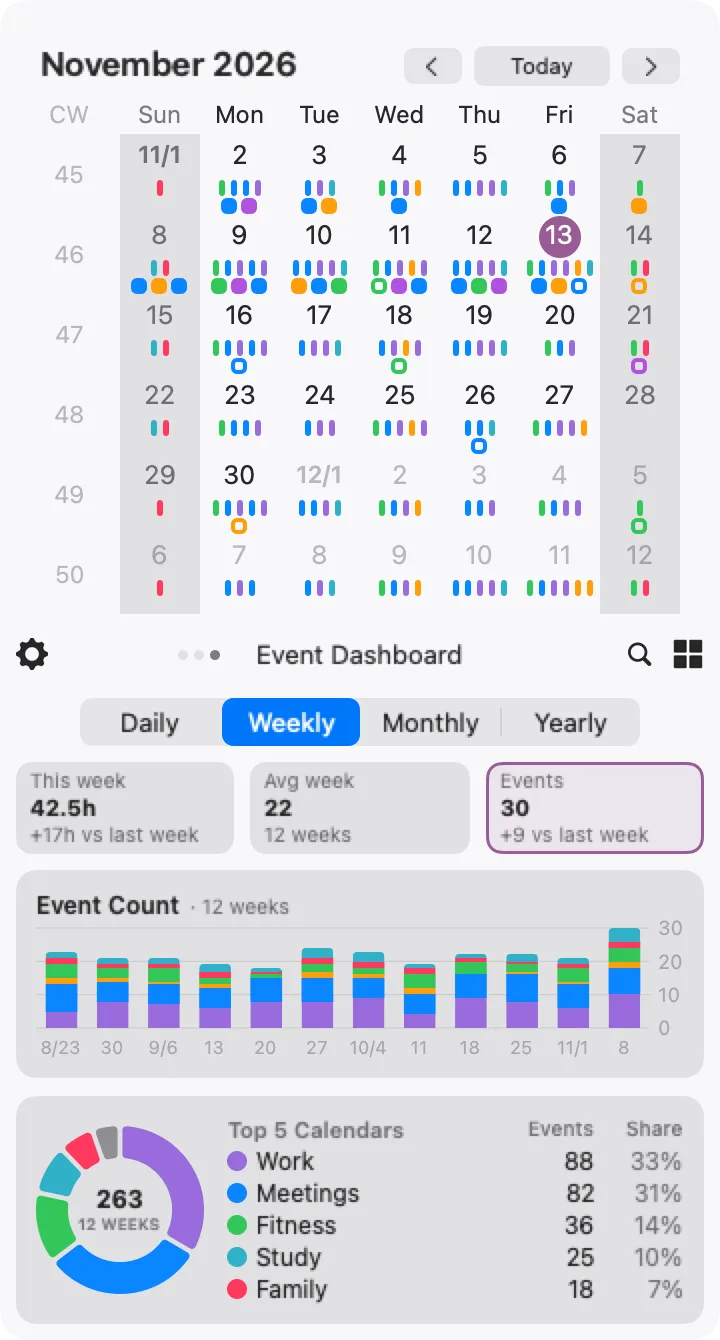
Choosing a period
Section titled “Choosing a period”Pick Daily, Weekly, Monthly or Yearly. Changing the period changes the tiles, the bars and the range being added up. Calinsight remembers the period separately for events and reminders, and keeps it the next time you launch it.
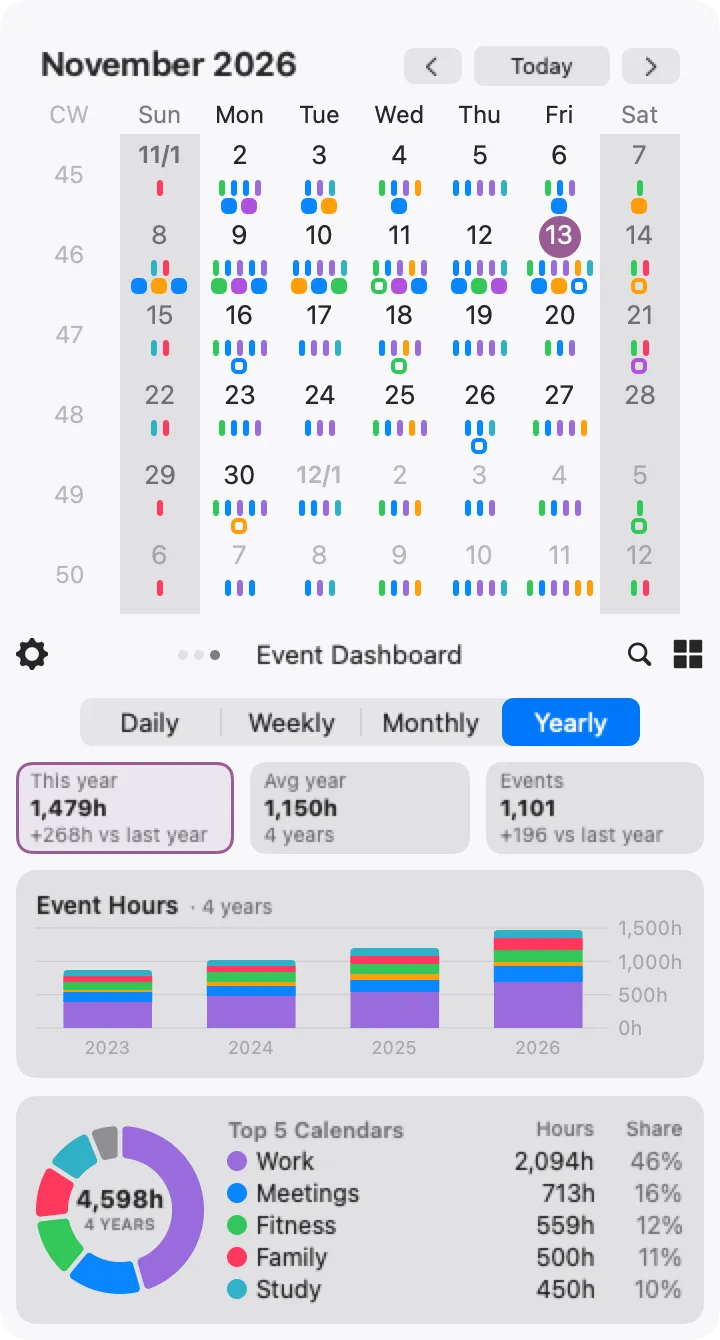
Reading the charts
Section titled “Reading the charts”- Bar chart — the hours (or count) per period, stacked by calendar. The title says how many periods are shown. In the daily view, the dashed line is the daily average
- Doughnut chart — the breakdown over all the periods shown. The number in the middle is the total
- Top 5 Calendars — the five busiest calendars, with their hours (or count) and share. For reminders it is Top 5 Lists
The Reminder Dashboard
Section titled “The Reminder Dashboard”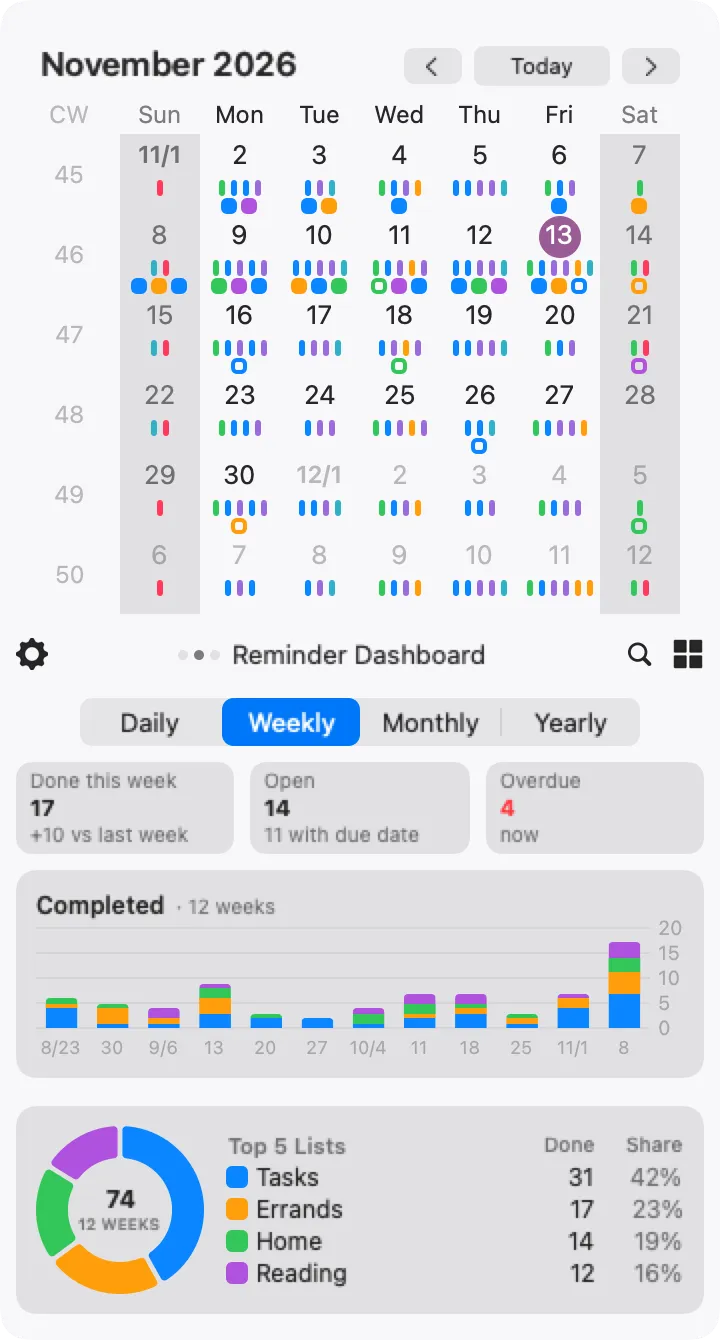
The Reminder Dashboard counts completed reminders: the first tile shows how many you completed in the current period and the difference from the previous one. The other two tiles are about right now, whatever the period: Open is the number of reminders still to do (and how many of them have a due date), and Overdue is how many of those are past their due date — it turns red when there is at least one. A reminder with a date but no time becomes overdue when that day ends.
Unlike the list and the grid, which keep a completed reminder on its due date, the dashboard counts it on the day you completed it, so a reminder finished after its due date is counted on the day you actually completed it.